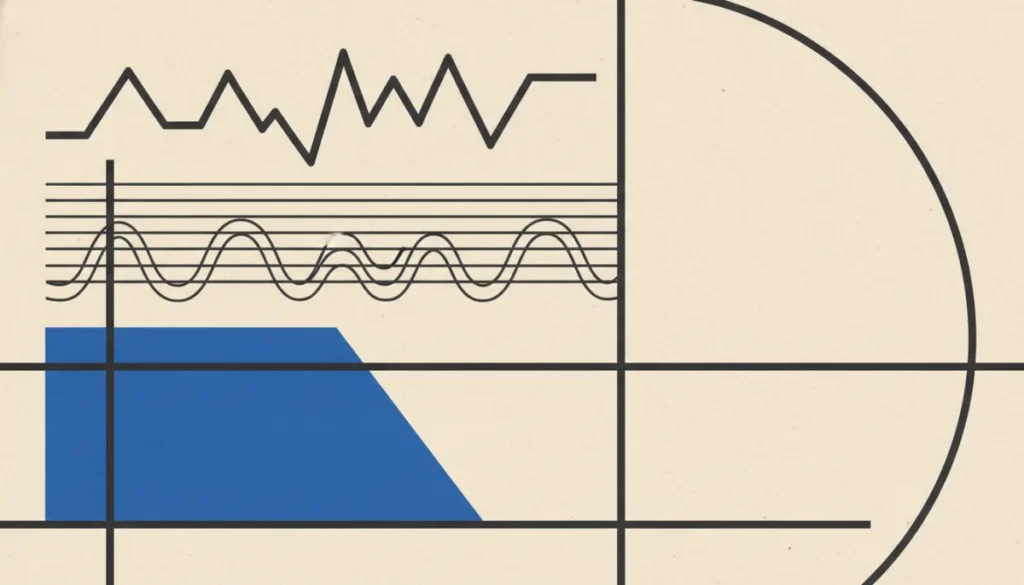
Technical analysis uses indicators derived from price and volume to describe market conditions. A few appear so often in coverage that they are worth understanding — as context, not prophecy.
Moving averages and RSI
A moving average smooths price to show its general direction. The Relative Strength Index (RSI) tries to gauge whether an asset is “overbought” or “oversold” on a 0-100 scale. Both are lagging or bounded measures, and both can stay “extreme” far longer than expected.
Use with humility
Indicators describe the past and present; they do not remove uncertainty. Traders combine several and still get it wrong often. Treat any single indicator, or anyone selling one as a sure thing, with deep skepticism. None of this is advice.
Educational content, not financial advice. Crypto is volatile and you can lose money. Do your own research. Crypto Ruble Coins is a news and education publication — not an exchange, conversion, or off-ramp service.
Last updated 14 Jul 2026

CryptoRubleCoins Author. Web3 since 2018. Traveler, & adventurer. My opinions are my own. No financial advice.